DC Bikeshare Patterns - Case Study
About the Dashboard
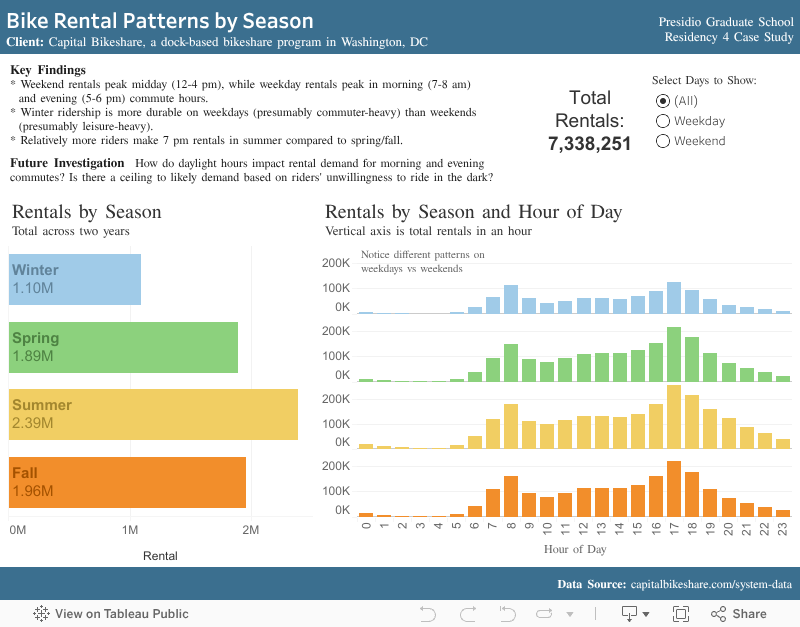
This dashboard is an artifact from a case study I taught in my role as Adjunct Professor of Data Analytics at Presidio Graduate School. Topics of focus that day included exploratory data analysis, finding a story in the data, using preattentive attributes like color to ease the viewer’s cognitive load (ex: choosing intuitive colors for seasons and carrying them across graphics), thinking strategically about laying out multiple sheets on a dashboard, and using filters to control multiple sheets at once in Tableau. I consider this more of a teaching tool than a robust finished product for a business end user.
Additional Links: Case Study Assignment | Cleaned Dataset | Raw System Data