Kindergarten Immunizations
About the Dashboard
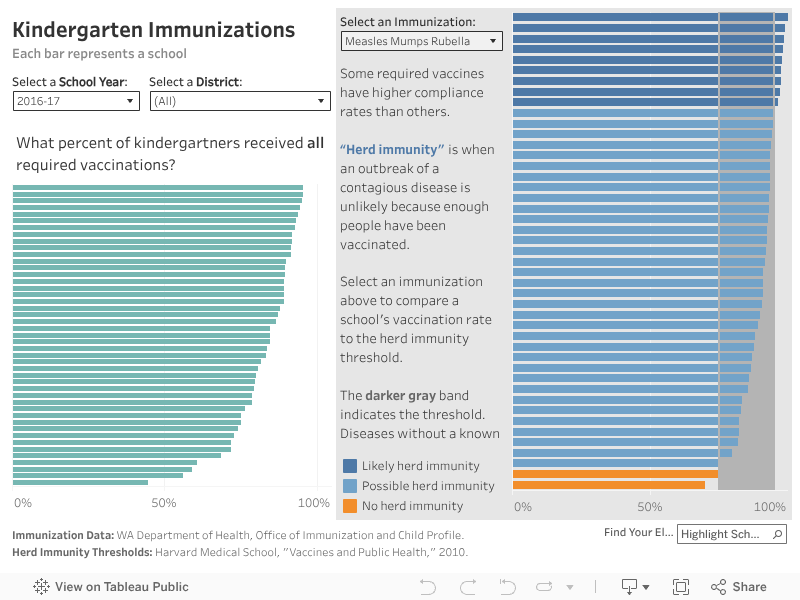
This project was a collaboration with a high school intern when I worked at Eastside Pathways. We compared kindergarten immunization rates per school to accepted thresholds for “herd immunity” against different illnesses. Key learnings for the student included how to implement a different reference band for each immunization’s threshold (or none, if no accepted standard was available) and using a color-blind palette. With more time, the next step would have been summarizing findings into call-outs on the dashboard, beginning with what percent of schools had herd immunity.
Additional Links: Newsletter write-up | Intern reflection