NYC Parks & Rec Project Planning - Case Study
About the Dashboard
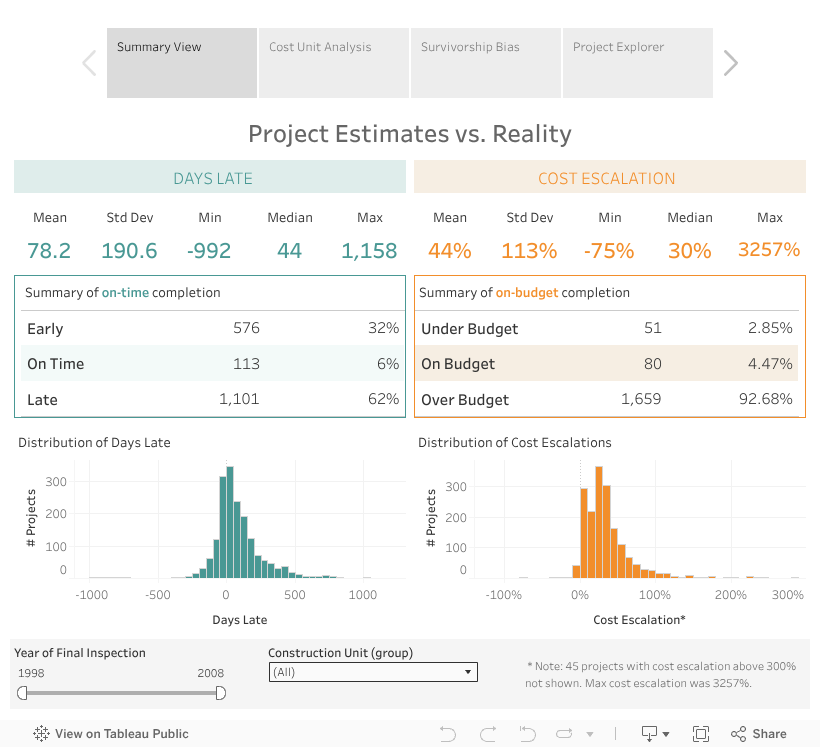
This dashboard is an artifact from a case study I taught in my role as Adjunct Professor of Data Analytics at Presidio Graduate School. Topics of focus that day included recoding continuous outcomes as categorical, addressing survivorship bias, and using color consistently to distinguish between outcomes.
Additional Links: Case Study (Paywalled) | Survivorship bias - Wikipedia