Traffic Fatalities
May 2018
Using a national dataset from 2015, I classified the outcome for each person in a traffic accident as "survived" or "fatality." This project used gradient-boosted decision trees and logistic regression to predict crash outcomes and shared results through Flask and Tableau interactive visualizations.

Motivation
Washington State has an ambitious goal, "Target Zero", to eliminate traffic deaths and serious injuries by 2030. I view this goal as aspirational rather than literal; as a former boss of mine used to say, "It's not about what the goal is, it's about what the goal makes you do." I would like to be part of the solution in reducing traffic deaths and making our roads safer.
Decoding the Dataset
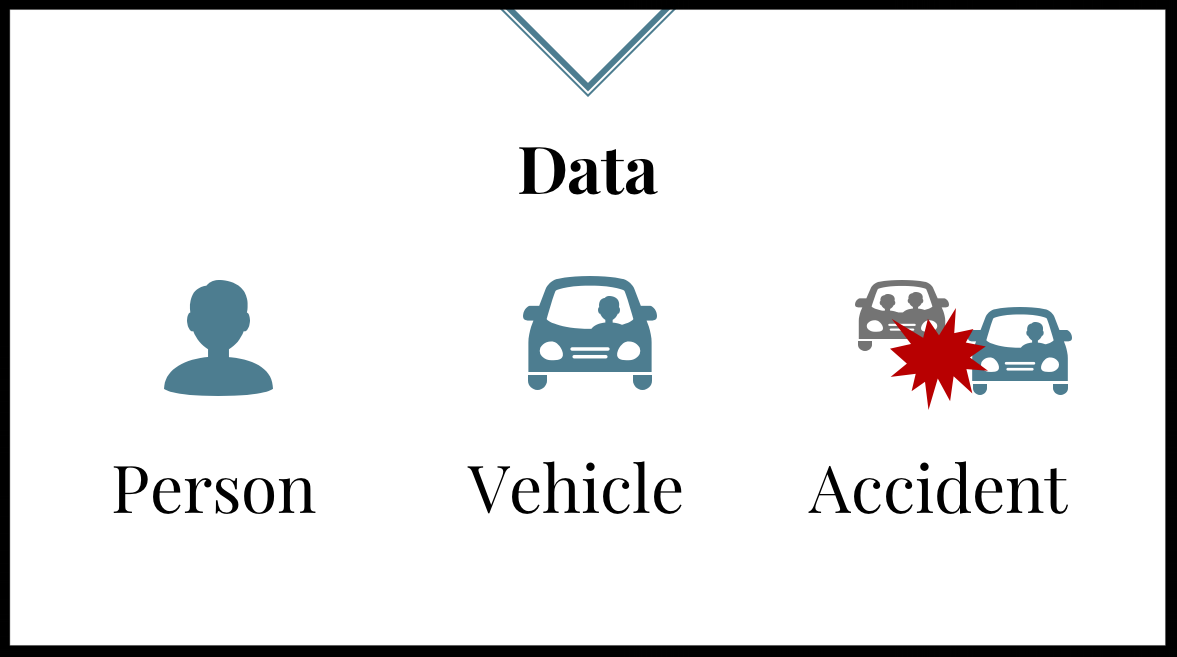
This dataset from the National Highway Traffic Safety Administration includes information on every U.S. motor vehicle accident with a fatality 2015. It is unusually detailed because of the investigation that surrounds a fatal accident. For my analysis, I pulled and merged from three related files (see image). Most details were recorded numerically and had to be decoded from a 600 page codebook. The final dataset included 48,000 observations (people) and 67 features.

Decision Trees with Categorical Data
For classification problems, decision trees are well suited to categorical data. I used CatBoost, which is a gradient-boosted decision tree model that iteratively learns from the previous tree's mistakes. I trained the model on 80% of the dataset and tested it on the remaining 20%.
Model Performance
A 2x2 confusion matrix (click to enlarge) reports how the model performed on the test set. The so-called "positive" condition was fatality because that is what the model sought to predict.
Accuracy (how often it was right): 89%. The model correctly classified 5,500 people who survived and 3,000 fatalities out of 9,500 total cases.
Recall (avoiding false negatives): 90%. In this use case, recall is more important than accuracy because we don’t want to miss warning signs of fatalities. We want to minimize the 331 box (those who were predicted to survive but actually suffered fatal injuries) because those are cases our model can’t explain and where further intervention and exploration are needed.

Visualization
Tableau: Viewers can explore the data in eight categories, including drunk drivers and the time of day of the accident, via a Tableau dashboard here.
Flask: In addition, a Flask web application runs on a more limited logistic regression model which predicts the probability of fatality given a set of user inputs. The app is not available publicly, but you can watch a demo here.
Results and Recommendations
Drunk driving, distracted driving, and not wearing a seatbelt are still key factors in traffic fatalities, and public dollars should continue to flow to these issues. Since several of the main culprits are areas where "everybody knows" the right behavior but people don't always do it, there seem to be limits to how much we can change motorist behavior with traditional methods. It is worth investigating new strategies, including technological and/or unconventional solutions.


Next Steps
Improve Model Recall: Tweak model by adjusting thresholds or adding features (e.g.) to reduce false negatives and improve recall.
Decode Sequence of Events: Use the chronological event data file to update dashboards with details of how the accident unfolded.
Analysis by State: Compare fatalities by state—normalized to that state’s population—to inform policy decisions at home in Washington.