WNBA Arena Noise Levels (WIP)
About the Dashboard
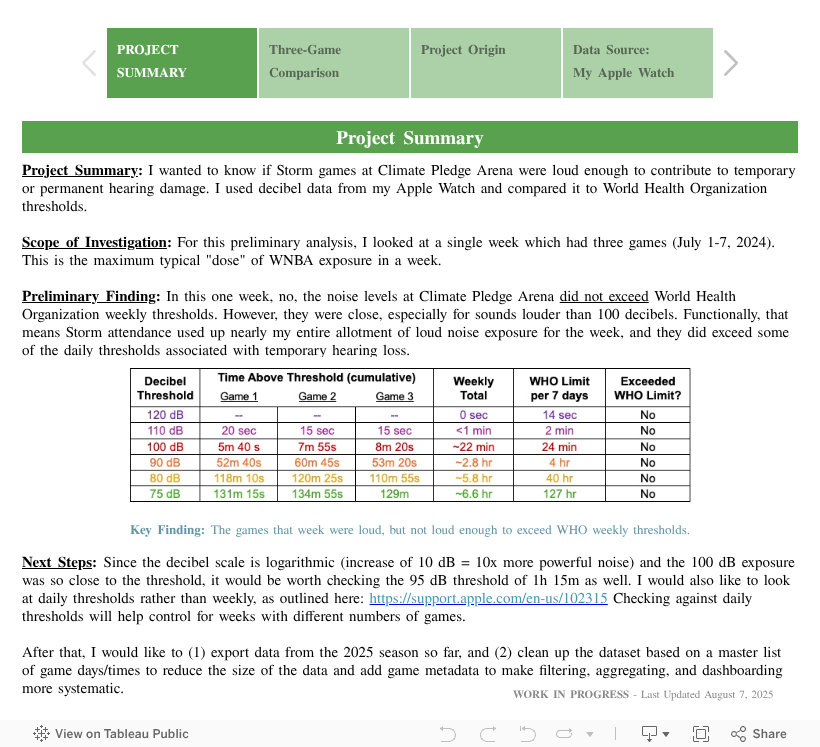
This work-in-progress passion project arose from my years of experience as a WNBA season ticket holder for the Seattle Storm and curiosity about how my perception of arena noise levels (loud!) matched up to reality (harmful, or just a nuisance?). The dashboard currently shows three games from a one-week period in 2024, with evidence that noise levels at Climate Pledge Arena approach the weekly World Health Organization limits for noise exposure in some cases and may exceed the daily recommendations. Either way, I now wear earplugs to games.
On the analysis side, the first problem was that my data source—an Apple Watch—was collecting data every five seconds, but the XML export from the built-in Health app on iPhone only included readings every 30 minutes. My workaround for this was to use a third-party app instead to get the full dataset, which then required exporting data in five-month chunks to keep file size down. As I continue working on this project, challenges include (1) keeping Tableau performant despite the size of the data and (2) joining game metadata to noise data to streamline and systematize analysis. Ultimately, working in partnership with Storm staff, my goal is to get a question added to the postgame fan experience survey that either specifically asks about noise levels or that allows for open-ended responses.
Additional Links: Decibel Thresholds | Simple Health Export CSV (app)