2015 Traffic Fatalities
About the Dashboard
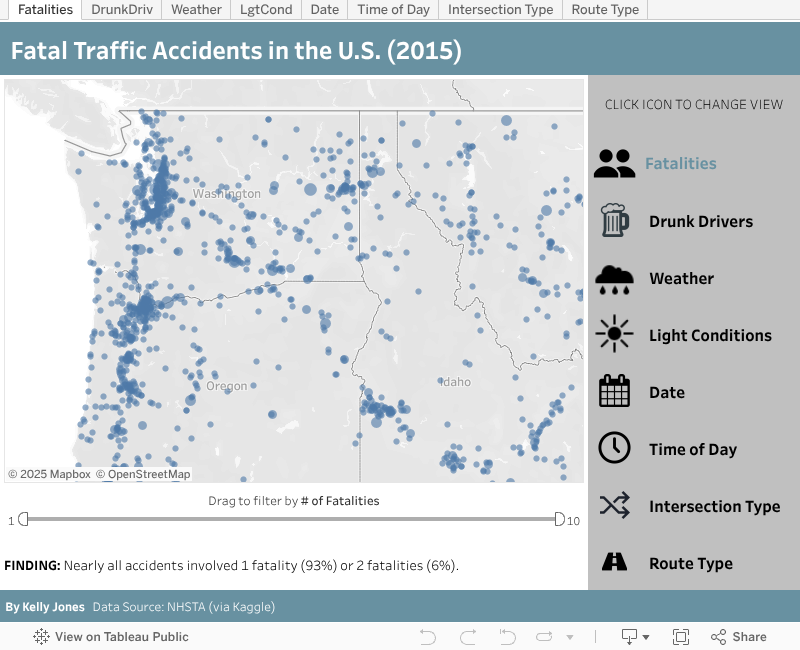
This Tableau dashboard maps public data from the National Highway Traffic Safety Administration along eight different dimensions to help visualize some of the factors at play in driving accidents that involved one or more fatality. It makes use of dashboard actions so that the icons on the sidebar click through to the different views. While it looks like a single dashboard, under the hood it is 8 dashboards and 17 sheets that are linked to create a seamless viewing experience for the end user.
Additional Links: Full Project Write-Up | Project Files (GitHub)